
Tips: BIRT
Tips: BIRT
Java Tips に書いていたのだが、 どうも量が壮大【日本語がヘン】になりそうなので、こちらに分離した。
BIRT の chart を使ってグラフを書く
install
BIRT の download のところから、 Latest Builds をダウンロードする。 Release Build、Milestone Build、Stable Build があるのだが、 どれを使えばいいのかよく分からない。 チャレンジャーでないのなら、 Release Build か Stable Build なのだが、 今回は Release Build (1.0.1) というのを使った。
ダウンロード候補の中から、 birt-charts-1_0_1.zip をダウンロードして展開する。 内容は Eclipse をインストールしたところに上書きするいつもの形式なので、 コピーすればインストールは完了。
なお、doc の eclipse/plugins/org.eclipse.birt.doc_1.0.1 の下に doc.zip というファイルが入っている。 これを展開すると API のドキュメントとかあるので、 展開して、 chart/api/index.html を見えるようにしておくといい。
サンプルプログラムの実行
次のようなプログラムを作って、 Eclipse 3.1 に読み込んで実行してみた。 なお、最初の方にある、
package com.phinloda.mytest;
この行は、 皆さんの環境に合わせて修正する必要があると思う。 あるいは、そういうパッケージを作ってしまう手もあるが。
/**
 * BIRT を使ってグラフを表示するテスト。
 * see BIRT chart FAQ
 */
package com.phinloda.mytest;

import java.util.ArrayList;

import org.eclipse.birt.chart.device.IDeviceRenderer;
import org.eclipse.birt.chart.exception.ChartException;
import org.eclipse.birt.chart.factory.Generator;
import org.eclipse.birt.chart.log.impl.DefaultLoggerImpl;
import org.eclipse.birt.chart.model.Chart;
import org.eclipse.birt.chart.model.ChartWithAxes;
import org.eclipse.birt.chart.model.attribute.Anchor;
import org.eclipse.birt.chart.model.attribute.AxisType;
import org.eclipse.birt.chart.model.attribute.Bounds;
import org.eclipse.birt.chart.model.attribute.IntersectionType;
import org.eclipse.birt.chart.model.attribute.LineAttributes;
import org.eclipse.birt.chart.model.attribute.LineStyle;
import org.eclipse.birt.chart.model.attribute.TickStyle;
import org.eclipse.birt.chart.model.attribute.impl.BoundsImpl;
import org.eclipse.birt.chart.model.component.Axis;
import org.eclipse.birt.chart.model.component.Series;
import org.eclipse.birt.chart.model.component.impl.AxisImpl;
import org.eclipse.birt.chart.model.component.impl.SeriesImpl;
import org.eclipse.birt.chart.model.data.NumberDataSet;
import org.eclipse.birt.chart.model.data.SeriesDefinition;
import org.eclipse.birt.chart.model.data.TextDataSet;
import org.eclipse.birt.chart.model.data.impl.NumberDataSetImpl;
import org.eclipse.birt.chart.model.data.impl.SeriesDefinitionImpl;
import org.eclipse.birt.chart.model.data.impl.TextDataSetImpl;
import org.eclipse.birt.chart.model.impl.ChartWithAxesImpl;
import org.eclipse.birt.chart.model.layout.Legend;
import org.eclipse.birt.chart.model.type.impl.LineSeriesImpl;
import org.eclipse.birt.chart.util.PluginSettings;
import org.eclipse.swt.SWT;
import org.eclipse.swt.events.PaintEvent;
import org.eclipse.swt.events.PaintListener;
import org.eclipse.swt.graphics.Rectangle;
import org.eclipse.swt.layout.GridData;
import org.eclipse.swt.layout.GridLayout;
import org.eclipse.swt.widgets.Canvas;
import org.eclipse.swt.widgets.Composite;
import org.eclipse.swt.widgets.Display;
import org.eclipse.swt.widgets.Shell;

/**
 * @author mai see BIRT chart FAQ http://www.eclipse.org/birt/faq/Charts_FAQ.doc
 *         36, 37
 */
public class ChartViewerTest implements PaintListener {

    private IDeviceRenderer renderer = null;

    private Chart myChart = null;

    /*
     * (non-Javadoc)
     *
     * @see org.eclipse.swt.events.PaintListener#paintControl(org.eclipse.swt.events.PaintEvent)
     */
    public void paintControl(PaintEvent event) {
        renderer.setProperty(IDeviceRenderer.GRAPHICS_CONTEXT, event.gc);
        Composite composite = (Composite) event.getSource();
        Rectangle rectangle = composite.getClientArea();
        Bounds bounds = BoundsImpl.create(rectangle.x, rectangle.y,
                rectangle.width, rectangle.height);
        bounds.scale(72d / renderer.getDisplayServer().getDpiResolution());

        Generator generator = Generator.instance();

        try {
            generator.render(renderer, generator.build(renderer
                    .getDisplayServer(), myChart, null, bounds, null));
        } catch (ChartException e) {
            e.printStackTrace();
        }

    }

    /**
     * @param args
     */
    public static void main(String[] args) {
        ChartViewerTest viewer = new ChartViewerTest();
        GridLayout gridLayout = new GridLayout();
        gridLayout.numColumns = 1;
        Display display = Display.getDefault();
        Shell shell = new Shell(display);
        shell.setSize(640, 480);

        shell.setLayout(gridLayout);
        shell.setText(viewer.getClass().getName() + "[device="
                + viewer.renderer.getClass().getName() + "]");

        GridData gridData = new GridData(GridData.FILL_BOTH);
        Canvas cCenter = new Canvas(shell, SWT.NONE);
        cCenter.setLayoutData(gridData);
        cCenter.addPaintListener(viewer);

        shell.open();

        while (shell.isDisposed() == false) {
            if (display.readAndDispatch() == false) {
                display.sleep();
            }
        }

        display.dispose();
    }

    /**
     * constructor
     *
     */
    ChartViewerTest() {
        System.setProperty("STANDALONE", "true");

        final PluginSettings pluginSettings = PluginSettings.instance();

        try {
            renderer = pluginSettings.getDevice("dv.SWT");
        } catch (ChartException e) {
            e.printStackTrace();
            DefaultLoggerImpl.instance().log(e);
        }

        myChart = createMyChart();
    }

    public static Chart createMyChart() {
        // 軸ありのグラフ(チャート)を作る
        ChartWithAxes chartWithAxes = ChartWithAxesImpl.create();

        // グラフの題名を指定する
        // この方法は Additional information の 1 に出ている
        chartWithAxes.getTitle().getLabel().getCaption()
                .setValue("最近のアクセス状況");

        // 凡例表示の設定。
        Legend legend = chartWithAxes.getLegend();

        // 凡例を囲む枠線の設定
        LineAttributes legendLineAttributes = legend.getOutline();
        // 点線に指定する
        legendLineAttributes.setStyle(LineStyle.DOTTED_LITERAL);
        // 枠線を表示する
        legendLineAttributes.setVisible(true);

        // 凡例の説明表示に使われるフォントサイズ
        legend.getText().getFont().setSize(16);

        // Insets を指定している。
        // Top=10, Left=5, Bottom=0, Right=0
        legend.getInsets().set(10, 5, 0, 0);

        // 凡例表示の位置。NORTH_LITERAL は上詰めで表示する。
        // SOUTH_LITERAL を指定すると、下詰めで表示する。
        legend.setAnchor(Anchor.NORTH_LITERAL);

        // 軸に関する設定を行う

        // x軸
        // getPrimaryBaseAxis()[0] は、x軸に対応する
        Axis xAxis = chartWithAxes.getPrimaryBaseAxes()[0];

        // 軸タイプを指定する。x軸は文字列に対応するように設定
        xAxis.setType(AxisType.TEXT_LITERAL);

        // ヒゲを下に出す
        xAxis.getMajorGrid().setTickStyle(TickStyle.BELOW_LITERAL);

        // x軸とy軸の交点がどこになるか指定する
        xAxis.getOrigin().setType(IntersectionType.VALUE_LITERAL);
        xAxis.getTitle().setVisible(false);

        // y軸
        // x軸と対応させた y軸
        Axis yAxis = (AxisImpl) chartWithAxes.getPrimaryOrthogonalAxis(xAxis);
        yAxis.getTitle().getCaption().setValue("アクセス数");
        yAxis.getTitle().setVisible(true);

        // ヒゲを左に出す
        yAxis.getMajorGrid().setTickStyle(TickStyle.LEFT_LITERAL);

        // x 軸に対応する DataSet を作る
        ArrayList categoryList = new ArrayList();
        categoryList.add("11/1");
        categoryList.add("11/2");
        categoryList.add("11/3");
        categoryList.add("11/4");
        categoryList.add("11/5");
        categoryList.add("11/6");
        categoryList.add("11/7");
        categoryList.add("11/8");
        categoryList.add("11/9");
        categoryList.add("11/10");

        TextDataSet categoryValues = TextDataSetImpl.create(categoryList);

        // y軸に対応する DataSet を作る
        ArrayList valueList = new ArrayList();
        valueList.add(new Double(180.0));
        valueList.add(new Double(197.0));
        valueList.add(new Double(167.0));
        valueList.add(new Double(240.0));
        valueList.add(new Double(235.0));
        valueList.add(new Double(225.0));
        valueList.add(new Double(424.0));
        valueList.add(new Double(242.0));
        valueList.add(new Double(414.0));
        valueList.add(new Double(207.0));

        NumberDataSet OrthogonalValues = NumberDataSetImpl.create(valueList);

        // x軸に対応する Series を作る
        Series categorySeries = SeriesImpl.create();
        categorySeries.setDataSet(categoryValues);

        // y軸に対応する Series を作る
        Series lineSeries = LineSeriesImpl.create();
        lineSeries.setDataSet(OrthogonalValues);

        // 折れ線の識別子。これは凡例に表示される文字列となる。
        lineSeries.setSeriesIdentifier("裏表");

        // WRAP THE BASE SERIES IN THE X-AXIS SERIES
        SeriesDefinition sdX = SeriesDefinitionImpl.create();
        sdX.getSeriesPalette().update(0); // SET THE COLORS IN THE PALETTE
        xAxis.getSeriesDefinitions().add(sdX);
        sdX.getSeries().add(categorySeries);

        SeriesDefinition sdY = SeriesDefinitionImpl.create();
        sdY.getSeriesPalette().update(1);
        yAxis.getSeriesDefinitions().add(sdY);

        sdY.getSeries().add(lineSeries);

        return chartWithAxes;

    }
}
このコードを Eclipse にそのままコピーすると、 build path の関係で、大量のエラーが出る。 Project > Properties > Java Build Path をメニューから選択し、 Libraries タブをクリックして、 Add External JARs を実行する。 ダウンロードしたファイル中にある、 全ての jar ファイルを追加する。 (全部必要ではないのかもしれないが、どれが必要なのかわからんので。)
この状態で birt.chart 系のエラーは全部消えて、 次に目立つのが swt 系のエラーになっているはず。 これは、swt.jar を Build path に追加すれば消える。
この状態でBoundsImpl.create の所がエラーになっている。 The type org.eclipse.emf.ecore.impl.EObjectImpl cannot be resolved. ということで、 コンパイルには EMF が必要ということがわかる。 EMF のサイトからダウンロードするのだが、 これまたどれが適切なのか分からない。 一貫性のない選択だが、 今回は SDK 2.2.0M3 をダウンロードして使うことにした。 ごちゃ混ぜだけど、いいのだろうか。 とりあえず、 org.eclipse.emf.ecore_2.2.0.jar を追加。 今度は、 org.eclipse.emf.common.notify.impl.BasicNotifierImpl cannot be resolved. というのが出た。 org.eclipse.emf.common_2.2.0.jar も追加。 これでエラーはなくなった。 ところが実行すると、こんな感じになる。
警告: No plugins in BIRT_HOME: /d:/java/birt-charts-1_0_1/eclipse/plugins/org
 .eclipse.birt.core_1.0.1/, make sure this directory is correct!
Exception in thread "main" java.lang.UnsatisfiedLinkError: no swt-win32-3212
 in java.library.path
    at java.lang.ClassLoader.loadLibrary(Unknown Source)
    at java.lang.Runtime.loadLibrary0(Unknown Source)
    at java.lang.System.loadLibrary(Unknown Source)
    at org.eclipse.swt.internal.Library.loadLibrary(Library.java:123)
    at org.eclipse.swt.internal.win32.OS.<clinit>(OS.java:18)
    at org.eclipse.swt.widgets.Display.<clinit>(Display.java:125)
    at org.eclipse.birt.chart.device.swt.SwtDisplayServer.<init>(SwtDisplayServer.java:80)
    at sun.reflect.NativeConstructorAccessorImpl.newInstance0(Native Method)
    at sun.reflect.NativeConstructorAccessorImpl.newInstance(Unknown Source)
    at sun.reflect.DelegatingConstructorAccessorImpl.newInstance(Unknown Source)
    at java.lang.reflect.Constructor.newInstance(Unknown Source)
    at java.lang.Class.newInstance0(Unknown Source)
    at java.lang.Class.newInstance(Unknown Source)
    at org.eclipse.birt.chart.util.PluginSettings.newInstance(PluginSettings.java:591)
    at org.eclipse.birt.chart.util.PluginSettings.getDisplayServer(PluginSettings.java:431)
    at org.eclipse.birt.chart.device.swt.SwtRendererImpl.<init>(SwtRendererImpl.java:106)
    at sun.reflect.NativeConstructorAccessorImpl.newInstance0(Native Method)
    at sun.reflect.NativeConstructorAccessorImpl.newInstance(Unknown Source)
    at sun.reflect.DelegatingConstructorAccessorImpl.newInstance(Unknown Source)
    at java.lang.reflect.Constructor.newInstance(Unknown Source)
    at java.lang.Class.newInstance0(Unknown Source)
    at java.lang.Class.newInstance(Unknown Source)
    at org.eclipse.birt.chart.util.PluginSettings.newInstance(PluginSettings.java:591)
    at org.eclipse.birt.chart.util.PluginSettings.getDevice(PluginSettings.java:370)
    at com.phinloda.mytest.ChartViewerTest.<init>(ChartViewerTest.java:125)
    at com.phinloda.mytest.ChartViewerTest.main(ChartViewerTest.java:88)
をーこれが有名なアレか…。 SWT FAQ には、
Q: Why do I get the error "java.lang.UnsatisfiedLinkError: no swt-win32-2034 in java.library.path."?
と出ている、まさにその通りの問題が残っているのだ。 Run ダイアログの Arguments に、
-Djava.library.path=D:/java/swt-3.2M3-win32-win32-x86
として実行。 これでこのエラーは解消して、次のようなグラフが表示されるはずだ。
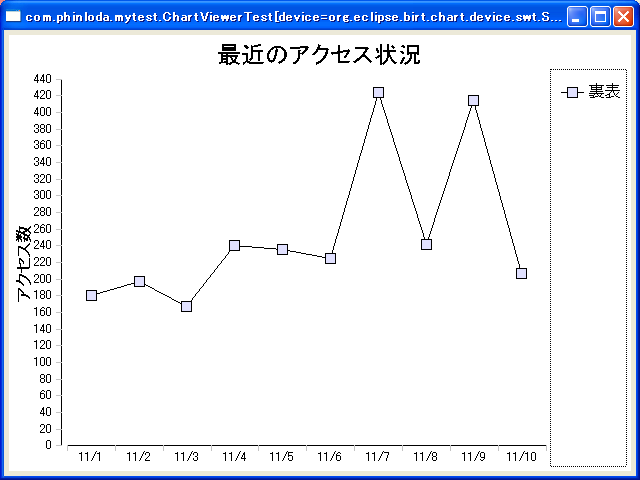
プログラムの解説
というか、概略に近いが。 まず、一番最後のメソッド、 createMyChart() が一番謎だと思うので、ここを解説。
        // 軸ありのグラフ(チャート)を作る
        ChartWithAxes chartWithAxes = ChartWithAxesImpl.create();
BIRT の Chart を使う場合、 まず、このように HogeHogeImpl.create() みたいなメソッドを呼び出してオブジェクトを生成してもらう。 ここでは、軸ありのグラフ(チャート)のオブジェクトを作っている。
ChartWithAxes クラスとは何か。 これは Chart クラスから派生している。 getter だけ紹介すると、こんな感じ。
| Chart |
+getBlock() : Block +getDescription() : Text +getDimension() : ChartDimension +getExtendedProperties() : org.eclipse.emf.common.util.EList +getGridColumnCount() : int +getLegend() : Legend +getPlot() : Plot +getSampleData() : SampleData +getScript() : String +getSeriesForLegend() : SeriesDefinition[] +getSeriesThickness() : double +getSubType() : String +getTitle() : TitleBlock +getType() : String +getUnits() : String +getVersion() : String |
org.eclipse.emf.common.util.EList というクラスが、この後も出てくるのだが、 これは java.util.List から派生したクラスで、 move というメソッドが追加されているだけ、というもの。
| EList <<interface>> |
+ move(int newPosition, int oldPosition) : Object + move(int newPosition, Object object) : void |
move メソッドは、 移動前の位置を指定するものと、 移動したい Object を直接指定するものの、2通りが用意されている。 こういう汎用的なメソッドは java.util に置いてあってもいいと思うが、 まあそれはそうとして、話を元に戻す。
軸を持つグラフを表示したい場合には、 Chart クラスから派生したクラスの ChartWithAxes を使う。 このクラスには、 次のような getter が追加されている。
| ChartWithAxes |
+ getAxes() : org.eclipse.emf.common.util.EList + getBaseAxes() : Axis[] + getFloorFill() : Fill + getOrientation() : Orientation + getOrthogonalAxes(Axis axBase, boolean bIncludePrimary) : Axis[] + getPrimaryBaseAxes() : Axis[] + getPrimaryOrthogonalAxis(Axis axBase) : Axis + getSeries(int iBaseOrOrthogonal) Series[] + getUnitSpacing() : double + getWallFill() : Fill |
軸を持つグラフを設定するときに、 軸の設定は重要なので、 Chart で指定できる要素だけで済むことはまずないと思われる。 つまり、ChartWithAxes クラスの操作が実際に必要になるので、 オブジェクトを受け取るときに、 Chart ではなく ChartWithAxes で受け取っているのだ。 なお、軸を持つグラフというのは、 折れ線グラフや棒グラフのことである。 では軸を持たないグラフとは何ぞやというと、 円グラフみたいな。
Chart は、 いくつかの領域を組み合わせた構造になっている。 グラフを描画する領域は Plot が受け持つのだが、 このソースでは全部デフォルトで済ませているので出てこない。 例えばグラフを描画する領域の背景色を指定したければ、 こんなことをすればいい。
        Plot plot = chartWithAxes.getPlot();
        ClientArea clientArea = plot.getClientArea();
        clientArea.setBackground(
                ColorDefinitionImpl.create(255, 255, 200));
グラフにタイトルを表示したい場合に使う領域は、 TitleBlock である。 これは Chart.getTitle() で get できる。
TitleBlock の中に Label があって、Caption があって… という構造になっていて、 確かによくできているのだが、 結構面倒。 ということで、実際こういう書き方をした。
        // グラフの題名を指定する
        // この方法は Additional information の 1 に出ている
        chartWithAxes.getTitle().getLabel().getCaption().setValue("最近のアクセス状況");
コメントに書いてあるように、 これは chart FAQ の、 Additional information の 1 の書き方を真似したものである。
次に凡例を指定している。 Legend というのが、凡例を表示するエリアに対応する。
        // 凡例表示の設定。
        Legend legend = chartWithAxes.getLegend();

        // 凡例を囲む枠線の設定
        LineAttributes legendLineAttributes = legend.getOutline();
        // 点線に指定する
        legendLineAttributes.setStyle(LineStyle.DOTTED_LITERAL);
        // 枠線を表示する
        legendLineAttributes.setVisible(true);

        // 凡例の説明表示に使われるフォントサイズ
        legend.getText().getFont().setSize(16);

        // Insets を指定している。
        // Top=10, Left=5, Bottom=0, Right=0
        legend.getInsets().set(10, 5, 0, 0);

        // 凡例表示の位置。NORTH_LITERAL は上詰めで表示する。
        // SOUTH_LITERAL を指定すると、下詰めで表示する。
        legend.setAnchor(Anchor.NORTH_LITERAL);
Inset というインターフェースは、 長方形領域の四隅を double の値で表現するもので、 上、左、下、右、の4つの位置に対応した Top, Left, Bottom, Right、の4つの属性を持つ。 これらを setter / getter でコントロールする。
Inset には、 各属性の値をセットしたか、何も指定していないか、 という状態も保持する機能もある。 例えば一度も Top が set されていなければ、 isSetTop() メソッドが false を返すはず。
次に、軸の設定。 ChartWithAxes 系のグラフの軸に関する設定は、 Axis クラスを使って行う。
        // x軸
        // getPrimaryBaseAxis()[0] は、x軸に対応する
        Axis xAxis = chartWithAxes.getPrimaryBaseAxes()[0];

        // 軸タイプを指定する。x軸は文字列に対応するように設定
        xAxis.setType(AxisType.TEXT_LITERAL);

        // ヒゲを下に出す
        xAxis.getMajorGrid().setTickStyle(TickStyle.BELOW_LITERAL);

        // x軸とy軸の交点がどこになるか指定する
        xAxis.getOrigin().setType(IntersectionType.VALUE_LITERAL);
        xAxis.getTitle().setVisible(false);
getPrimaryBaseAxes() に関しては、 例の FAQ に詳しく書いてあるので省略するが、 要するに最初の1つの軸はこれで生成するらしい。
今回は横軸は文字を指定するので、 TEXT_LITERAL を指定している。 TEXT と TEXT_LITERAL の違いなのだが、 型が違うというか、 とりあえず横軸に文字を表示したければ TEXT_LITERAL にしておけばよいのではなかろうか。
tickStyle というのは、 軸の目盛りのところに出ているヒゲのようなアレ。 BELOW_LITERAL というのは、 軸から下に向かってヒゲを出すことを指定している。
Axis.getOrigin() で AxisOrigin オブジェクトを受け取って、 その内容を設定している。 この AxisOrigin クラスは座標原点を表現するもので、 Type と Value の 2つの属性を持っている。 ここでは、Type として、 IntersectionType.VALUE_LITERAL を指定している。
次に、y軸の設定を行う。 y座標は、x軸に対する直交座標となるので、 getPrimaryOrthogonalAxis メソッドを使って、 xAxi に対応付けたオブジェクトを受け取っている。
        // y軸
        // x軸と対応させた y軸
        Axis yAxis = (AxisImpl) chartWithAxes.getPrimaryOrthogonalAxis(xAxis);
        yAxis.getTitle().getCaption().setValue("アクセス数");
        yAxis.getTitle().setVisible(true);

        // ヒゲを左に出す
        yAxis.getMajorGrid().setTickStyle(TickStyle.LEFT_LITERAL);
setTickStyle は、ヒゲを左に出す指定。
続いて、 x座標の値を DataSet として指定する。 今回は、文字列を対応付ける。
        // x 軸に対応する DataSet を作る
        ArrayList categoryList = new ArrayList();
        categoryList.add("11/1");
        categoryList.add("11/2");
        categoryList.add("11/3");
        categoryList.add("11/4");
        categoryList.add("11/5");
        categoryList.add("11/6");
        categoryList.add("11/7");
        categoryList.add("11/8");
        categoryList.add("11/9");
        categoryList.add("11/10");

        TextDataSet categoryValues = TextDataSetImpl.create(categoryList);
続いて、 これらの DataSet に対して、 値がどうなのかということを指定する。 これは y 軸の値になる。
        // y軸に対応する DataSet を作る
        ArrayList valueList = new ArrayList();
        valueList.add(new Double(180.0));
        valueList.add(new Double(197.0));
        valueList.add(new Double(167.0));
        valueList.add(new Double(240.0));
        valueList.add(new Double(235.0));
        valueList.add(new Double(225.0));
        valueList.add(new Double(424.0));
        valueList.add(new Double(242.0));
        valueList.add(new Double(414.0));
        valueList.add(new Double(207.0));

        NumberDataSet OrthogonalValues = NumberDataSetImpl.create(valueList);
x軸に対応する Series を作る。
        // x軸に対応する Series を作る
        Series categorySeries = SeriesImpl.create();
        categorySeries.setDataSet(categoryValues);
y軸も同様だが、 y軸には identifier を指定している。 ここで指定した String が、凡例のところに表示される。
        // y軸に対応する Series を作る
        Series lineSeries = LineSeriesImpl.create();
        lineSeries.setDataSet(OrthogonalValues);

        // 折れ線の識別子。これは凡例に表示される文字列となる。
        lineSeries.setSeriesIdentifier("裏表");
次にここがよく分からないのだが、 SeriesDefinition を作って、 軸にセットする。
        // WRAP THE BASE SERIES IN THE X-AXIS SERIES
        SeriesDefinition sdX = SeriesDefinitionImpl.create();
        sdX.getSeriesPalette().update(0); // SET THE COLORS IN THE PALETTE
        xAxis.getSeriesDefinitions().add(sdX);
        sdX.getSeries().add(categorySeries);
これはもしかして、
        // WRAP THE BASE SERIES IN THE X-AXIS SERIES
        SeriesDefinition sdX = SeriesDefinitionImpl.create();
        sdX.getSeriesPalette().update(0); // SET THE COLORS IN THE PALETTE
        sdX.getSeries().add(categorySeries);
        xAxis.getSeriesDefinitions().add(sdX);
と書いてはいけないのだろうか、 とか思うのだが、 FAQ のサンプルがそうなっているので、 とりあえずコードは元の順序のままにしておいた。 こんなのが順番変えたら動かないなんてことはあり得ないと思うが、 念のため。
一応考えておくと、 Series というのが「列」ということで、 数値なら数列に対応するのだが、 今回は文字列が入った ArrayList を使って横軸を作っているから、 横軸は、ArrayList の要素が並んだ列、という感じになる。
getSeriesPalette() というのがよく分からないのだが、 標準的な色の組み合わせがあらかじめ指定されていて、 0番目のグループの組み合わせの色に初期化している、ということらしい。
(UNDER CONSTRUCTION)